Table of Contents
Introduction
I hope to provide some easy-to-digest data on the two biggest economies in the world, the increase in fiscal deficits as of 2020 and a quick overview of the trade deficit between USA and China over the last few years.
USA Metrics
Here is a table I created to show the total debt, real GDP, fiscal deficit and the Debt/GDP ratio of the United States over the last few years.
| Year | Metrics for USA | Value ( USD ) |
|---|---|---|
| 2016 | Total Debt | 19.57 trillion |
| Real GDP | 18.72 trillion | |
| Debt/GDP | 1.0454 | |
| 2017 | Total Debt | 20.24 trillion |
| Real GDP | 19.52 trillion | |
| Deficit | 665 billion | |
| Debt/GDP | 1.0369 | |
| 2018 | Total Debt | 21.52 trillion |
| Real GDP | 20.58 trillion | |
| Deficit | 779 billion | |
| Debt/GDP | 1.0457 | |
| 2019 | Total Debt | 22.72 trillion |
| Real GDP | 21.43 trillion | |
| Deficit | 984 billion | |
| Debt/GDP | 1.0602 | |
| 31-Aug-20 | Total Debt | 26.70 trillion |
| Real GDP | 19.41 trillion (Projected EOY 20.4 trillion) | |
| Deficit | 3 trillion | |
| Debt/GDP | 1.3088 | |
| Table 1. Total Debt, GDP, Fiscal Deficit and Debt/GDP ratios of USA |
The US Congress enacted a $2.2 trillion Coronavirus Aid, Relief, and Economic Security Act (CARES) package which contributed to the inflated deficit of $3 trillion in August 2020. The Congressional Budget Office projected that the deficit would hit $3.3 trillion by the end of year 2020. [Source1 and Source 2]
Will this additional deficit result in a proportionate increase in real GDP? Very likely not. In fact, the United States Congressional Budget Office says, "At 16.0 percent of gross domestic product (GDP), the deficit in 2020 would be the largest since 1945."
I also calculated the Debt/GDP ratios in the table above. On August 31, 2020, the US debt was 130.88% of the total GDP. These numbers are subject to change by the end of the year, with the ratio projected to be around 100%. Compare this with the Debt/GDP ratio of 52% during the 2008-09 financial crisis.
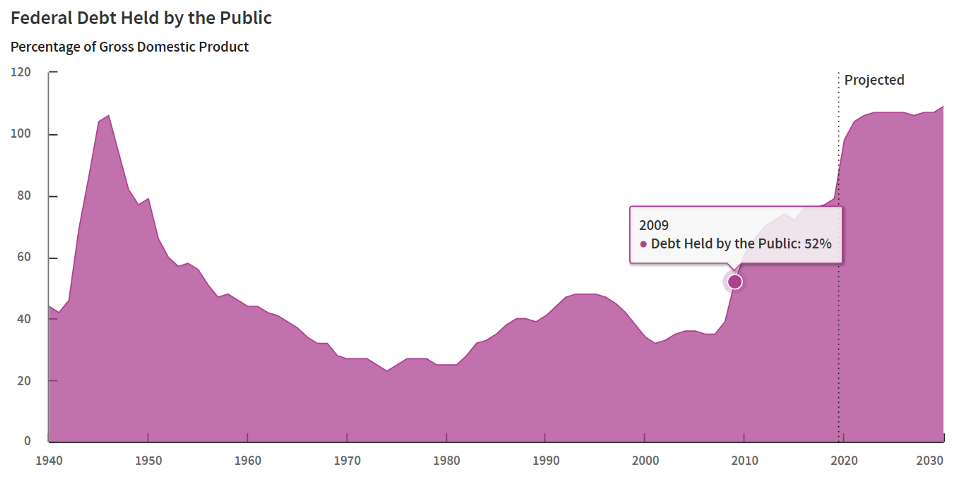 Image 1. The Debt/GDP was 52% in 2009 during the financial crisis
Here's the source.
An interesting side note here is what the average American adult thinks of this deficit. The Pew Research Center conducted a survey on 4,708 U.S. adults from June 16 to 22, 2020, and only 47% of them considered this a "very big problem". This is surprising indeed. I would have expected a much higher percentage. [Source]
How is China doing?
Let me attempt to compare this with China, the second biggest economy in terms of real GDP. Some of these are approximate values – quite close to the real values - and may serve to estimate the direction of growth.
| Year | Metrics for China | Value ( USD ) |
|---|---|---|
| 2016 | Total Debt | 4.67 trillion |
| Real GDP | 11.22 trillion | |
| Deficit | 413 billion (approx.) | |
| Debt/GDP | 0.4162 | |
| 2017 | Total Debt | 5.40 trillion |
| Real GDP | 12.06 trillion | |
| Deficit | 470 billion (approx.) | |
| Debt/GDP | 0.4478 | |
| 2018 | Total Debt | 6.35 trillion |
| Real GDP | 13.41 trillion | |
| Deficit | 645 billion (approx.) | |
| Debt/GDP | 0.4735 | |
| 2019 | Total Debt | 7.52 trillion |
| Real GDP | 14.22 trillion | |
| Deficit | 861 billion (approx.) | |
| Debt/GDP | 0.5288 | |
| 2020 projections | Total Debt | 8.87 trillion |
| Real GDP | $15.47 trillion | |
| Deficit | >1.2 trillion | |
| Debt/GDP | 0.5734 | |
| Table 2. Total Debt, GDP, Fiscal Deficit and Debt/GDP ratios of China |
The real GDP has moved from 11 all the way to around 16 trillion, while the debt has moved from 5 to about 9 trillion. I do not have to add anything else here. The growth rate is phenomenal. The Chinese fiscal deficit, however, has ballooned to over USD 1.2 trillion , most likely because of the recent USD 500 billion stimulus package (less than 1/4th the size of the US package) passed by its government. [Source]
The Debt/GDP ratios I calculated above are also interesting. The debt in 2019 was only 52.88% of its GDP. This is in stark contrast to America's 106%. In fact, China's Debt/GDP ratio has increased from 41.62% in 2016 to about 60% in 2020, whereas America has stayed constantly above 100%. China seems to be using its debt better than the United States. The Debt/GDP ratio based on 2020 projections is still lower than 60%, which is where America was in 2009.
Here are some basic charts that depict the same thing described above.
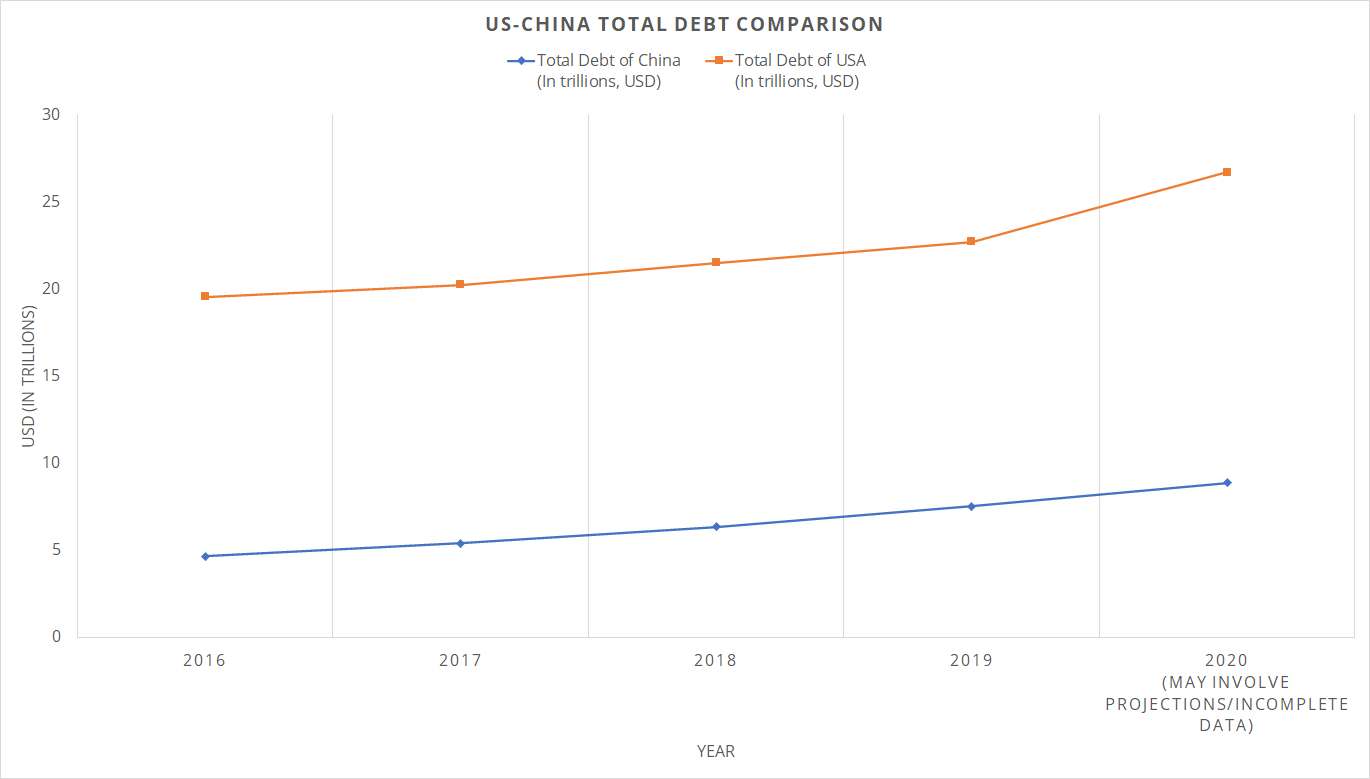 Image 2. US-China debt comparison, 2016–2020
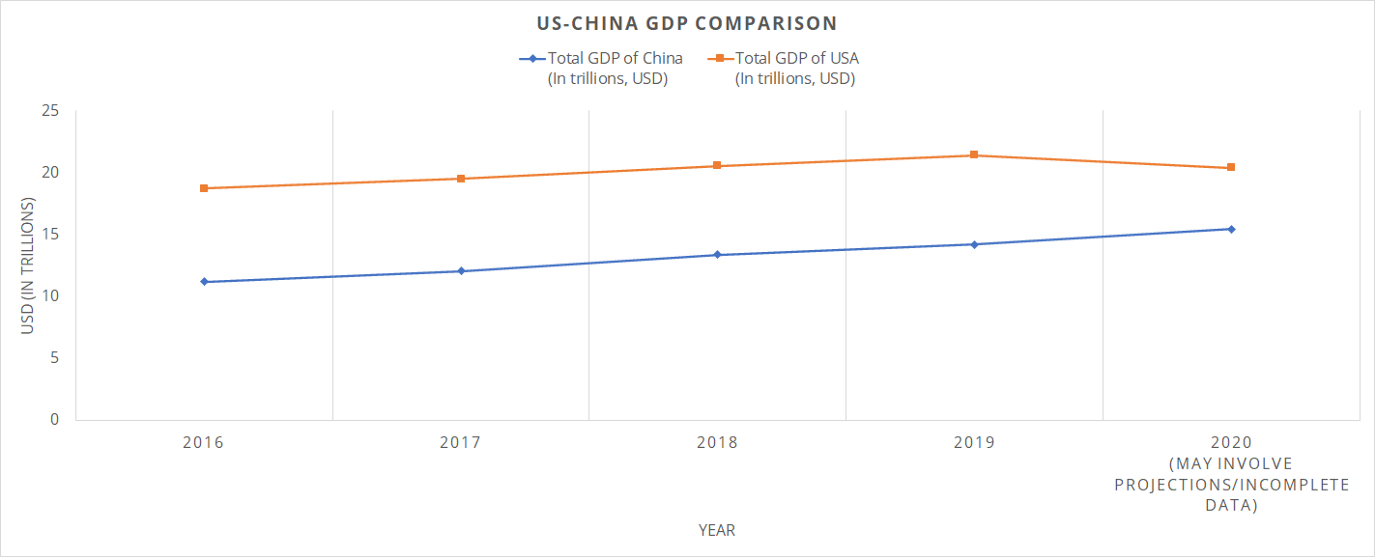 Image 3. US-China real GDP comparison
Trade deficit
In a September 2020 speech, the US President lashed out at China. He said, "We will make America into the manufacturing superpower of the world and will end our reliance on China once and for all. Whether it's decoupling, or putting in massive tariffs like I've been doing already, we will end our reliance in China, because we can't rely on China… We will bring jobs back from China to the United States and we will impose tariffs on companies that desert America to create jobs in China and other countries." [Source]
There are several reasons for this hostility. One basic reason could be this: In 2016, the US trade deficit on goods with China was $347 billion. In 2019, it was $345.6 billion. The trade deficit has not gone down much in 4 years. In fact, it was $315 billion in 2012. The deficit has stayed almost the same.
The deficit widened to 12-year highs in July 2020, quite understandably due to the pandemic. [Source]
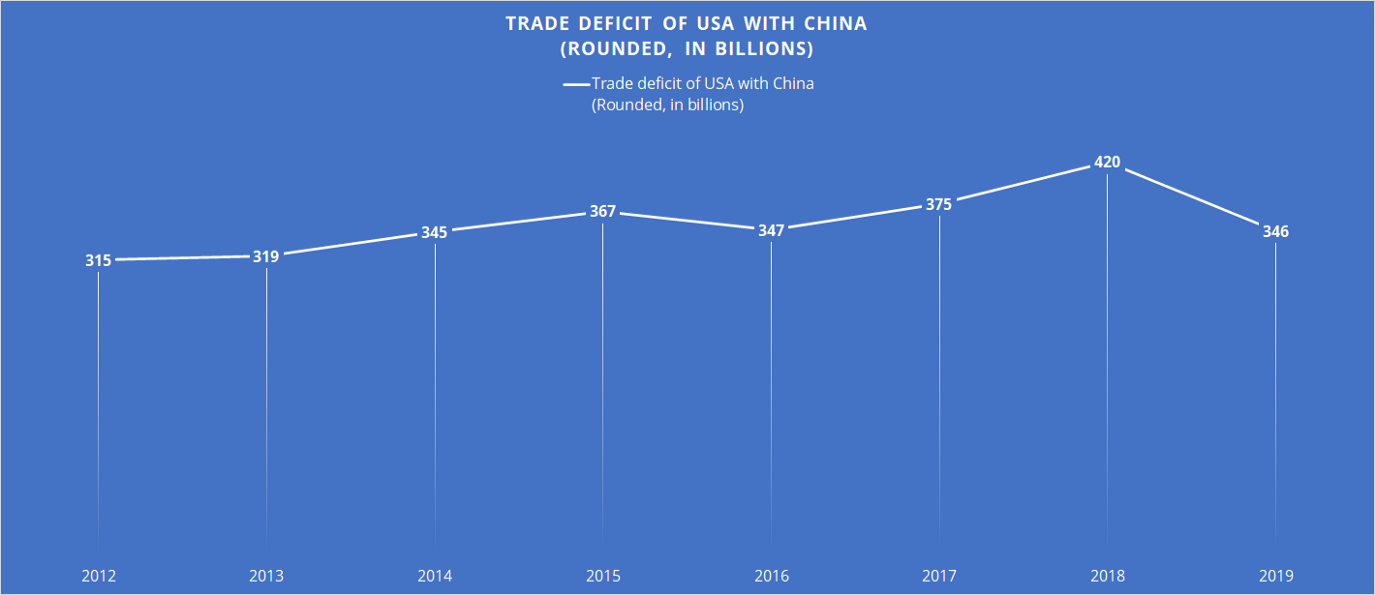 Image 4. US-China trade deficit in billions of US dollars
I hope that this article has provided some easy-to-digest data on the two biggest economies in the world, the growing importance of printing money in times of crises and a quick overview of the stagnant trade deficit between USA and China over the last few years.